


- 《答聂文蔚》 [2017/04]
- 奥巴马致女友:我每天都和男人做爱 [2023/11]
- 爱国者的喜讯,干吃福利的绿卡族回国希望大增 [2017/01]
- 周五落轨的真的是个华女 [2017/03]
- 现场! 全副武装的警察突入燕郊 [2017/12]
- 法拉盛的“鸡街”刚刚又闹出人命 [2017/11]
- 大部分人品太差了--- 中国公园里的“黄昏恋” [2019/12]
- 亚裔男孩再让美国疯狂 [2018/09]
- 年三十工作/小媳妇好吗 /土拨鼠真屌/美华素质高? [2019/02]
- 看这些入籍美加的中国人在这里的丑态百出下场可期 [2019/11]
- 黑暗时代的明灯 [2017/01]
- 看看谁给华涌女儿过生日了? [2017/12]
- 智利中國留學生攻擊支持香港遊行的臺灣炸雞店 [2019/08]
- 当今的美国是不是还从根本上支持中国的民主运动? [2017/10]
- 文革宣传画名作选之 “群丑图” 都画了谁? [2024/01]
- 国民劣根性背后----为什么中国人这么坏! [2023/10]
- 香港的抗争再次告诉世人 [2019/06]
- Why Xi Jinping’s (Airbrushed) Face Is Plastered All Over China [2017/11]
- 中国女欢呼日本地震 欧洲老公惊呆上网反思 [2024/01]
- 加入外国籍,你还是不是中国人?谈多数华人的愚昧和少数华人的觉醒 [2018/02]
- 周末逛法拉盛,还是坐地铁? [2017/10]
- 春蚕到死丝方断, 丹心未酬血已干 [2017/03]
- 1919年的两本书之:凯恩斯如何预见德国的崛起和后果 [2019/12]
美洲印第安人(Native Americans)也称美洲原住民,在欧洲移民到达美洲之前,他们的祖先已经在这片大陆上繁衍生息了上万年。美洲印第安人从何而来?他们的祖先是谁?这一直是学术界广泛关注的问题。以往研究表明,美洲印第安人的祖先主要来源于西伯利亚,在末次盛冰期(Last Glacial Maximum,LGM;26500-19000年前),随着海平面的下降在如今白令海峡区域形成了一条连通欧亚大陆和美洲大陆的桥梁——白令陆桥(Beringia),他们的祖先通过此陆桥进入美洲。这一结论在单系遗传标记线粒体DNA(mitochondrial DNA;mtDNA)的研究中得到了呼应,例如美洲印第安人mtDNA奠基类群A2、B2、C1、C4c和D1等,都可在西伯利亚找到最近共同祖先。
不过,少数mtDNA类群的起源和扩散至今仍存在疑问,例如美洲原住民的奠基类群(funder type)D4h3a。在2009年,该类群的姐妹类群(与其遗传关系最近的类群)D4h3b首次在中国青岛(1个个体)被报道。在随后的十余年中,仅有另外两个个体在泰国人群中发现,这似乎提示,该类群可能有着区别于其他类群的起源。
为系统追溯美洲印第安人建群类群D4h3a的起源和扩散历史,获取并分析D4h3a的祖先类群(D4h)的数据是关键。然而,D4h在亚洲人群的频率非常低(例如在中国汉族人群中仅为~0.5%),这对研究造成了极大的阻碍。为了解决这一问题,中国科学院昆明动物所的孔庆鹏团队与意大利帕维亚大学、成都二十三魔方生物科技有限公司、上海司法鉴定研究院开展合作。团队经过十余年的搜寻,最终在超10万份的现代欧亚人群mtDNA数据集中,筛选到了216个D4h的线粒体全基因组数据(其中106个为本研究新获得)。同时,团队成员还在逾1.5万份古DNA数据中进行了查找,最终获得了39个D4h的古DNA数据。这些数据对“重建”该类群的起源扩散历史提供了重要保障。
结果表明,无论是从古DNA还是从现代人群DNA来看,D4h的分布主要在中国北方沿海地区。此外,较为古老的支系也主要分布在中国北方沿海。相比而言,西伯利亚地区仅有零星的发现。这提示,该类群的起源地可能与其他类群不同,可能是在较为南方的中国北部沿海地区。此外,综合古DNA和现代人DNA,采用分子钟校正的方法,研究人员发现了D4h在中国北方沿海地区经历了两次扩散事件:第一次是在LGM时期,D4h3a和D4h3b的祖先产生,而在该时期即将结束时(约19400年前),D4h3a与祖先人群分离,后进入美洲;第二次扩散发生在LGM后的冰消期,可能与该时期气候变暖有关。在这两个时期,由于海平面下降,现今中国北方沿海地区以陆地相连,使得两次扩散事件成为可能。
值得注意的是,第二次扩散还对日本原住居民,包括绳纹人(Jomons)和阿依努人(Ainu)产生了遗传贡献。巧合的是,这种遗传上的联系,与旧石器时期太平洋沿海地区尤其是日本和美洲的文化相似性(如尖状器或长矛(stemmed points))非常吻合。考虑到以往观点认为D4h3a进入美洲后主要沿海岸线迁徙,研究团队推测:在末次盛冰期后,D4h的部分类群可能主要沿海岸线迁徙到达日本和美洲。这也支持了部分早期美洲印第安人可能沿海岸线迁徙到达美洲的观点。
相关研究论文“Mitogenome evidence shows two radiation events and dispersals of matrilineal ancestry from northern coastal China to the Americas and Japan”于5月10日发表在际知名学术期刊Cell Reports(https://doi.org/10.1016/j.celrep.2023.112413)。中科院昆明动物研究所的副研究员李玉春、博士研究生郜宗亮为共同第一作者,孔庆鹏研究员为通讯作者。意大利帕维亚大学Antonio Torroni教授、Alessandro Achilli教授、Ornella Semino教授,成都二十三魔方生物科技有限公司的刘开军,以及上海司法鉴定研究院的李成涛教授、张素华教授对该工作给予了大量帮助和支持。该研究得到了国家自然科学基金、国家重点研发计划、中科院先导A类计划等项目的支持。 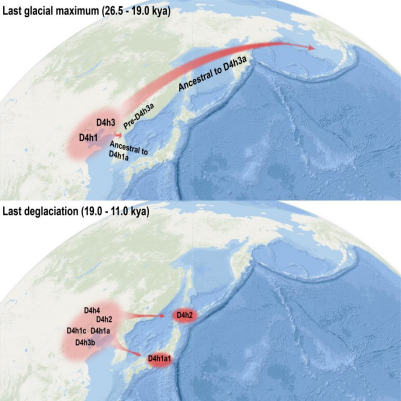

图注:D4h类群在末次盛冰期(2.65-1.90万年)与冰消期(1.90-1.10万年)的两次扩散事件
Report
Mitogenome evidence shows two radiation events and dispersals of matrilineal ancestry from northern coastal China to the Americas and JapanUnder a Creative Commons license
open access
Highlights
- •
The Native American lineage D4h3a can trace its ancestry to northern coastal China
- •
Radiations of D4h contribute to gene pools of Native Americans and Japanese
- •
Coastal radiations of D4h support the coastal route of early Native Americans
Summary
Although it is widely recognized that the ancestors of Native Americans (NAs) primarily came from Siberia, the link between mitochondrial DNA (mtDNA) lineage D4h3a (typical of NAs) and D4h3b (found so far only in East China and Thailand) raises the possibility that the ancestral sources for early NAs were more variegated than hypothesized. Here, we analyze 216 contemporary (including 106 newly sequenced) D4h mitogenomes and 39 previously reported ancient D4h data. The results reveal two radiation events of D4h in northern coastal China, one during the Last Glacial Maximum and the other within the last deglaciation, which facilitated the dispersals of D4h sub-branches to different areas including the Americas and the Japanese archipelago. The coastal distributions of the NA (D4h3a) and Japanese lineages (D4h1a and D4h2), in combination with the Paleolithic archaeological similarities among Northern China, the Americas, and Japan, lend support to the coastal dispersal scenario of early NAs.
Keywords
ancestral source
northern coastal China
two radiation events
Native Americans
Japanese
mitogenomes
haplogroup D4h
coastal route
Research topic(s)
CP: Genomics
Introduction ResultsDifferentiation of D4h3 and D4h in Central and North China

a
Resource availabilityLead contact
AcknowledgmentsAs the last continent settled by modern humans, the peopling of the Americas and subsequent dispersals within the continent have been the focus of intense interest by geneticists.1,2,3,4,5,6 Previous studies have shown that the ancestors of Indigenous Americans, also called Native Americans (NAs), originated in Asia, most likely in the eastern part of Asia,3,6,7,8,9 and settled in the Americas by means of multiple dispersals through Siberia/Beringia10 via the coastal route and possibly the inland ice-free corridor,11 followed by later divergence into sub-groups.12
The origin of early NAs, to date, has been attributed to a complex process involving multiple dispersals from different source places. As indicated by substantial investigations, besides the widely recognized Siberian ancestry, ancestries from other places, although limited, have also been identified, including North Asia,6,9 East Asia,6,13 Southeast Asia,14 and even Australo-Melanesia.15 In agreement with these observations, evidence from uniparental markers further indicates that the majority of NAs show closer genetic affinity to Siberians, as manifested by NA founder types, e.g., mitochondrial DNA (mtDNA) haplogroups A2, B2, C1, C4c, D1, etc.,16,17,18,19 and Y chromosome haplogroups Q-L54 (Q-Z780, Q-M848, and Q-M4303) and C-L1373 (C-MBP373),19,20,21,22,23,24 and thus may trace their ancestral sources in Siberia. In contrast, a sister lineage of the NA matrilineal founder D4h3a,25,26 viz., D4h3b, has been so far observed only in China25 and Thailand,27,28 suggesting that the ancestral maternal sources for early NAs were not restricted to Siberia but were from a much wider Asian geographic range.
To address this issue, an investigation integrating all available D4h data from a large-scale dataset covering the whole of Eurasia is needed. Given that D4h3 and its ancestor type D4h are relatively rare in contemporary populations (∼0.5%),29 we surveyed a total of 101,319 Eurasian individuals and identified the mtDNAs belonging to D4h3 and its ancestral node D4h. These included 60,979 samples for which partial sequence data, mainly hypervariable segment (HVS) data (Table S1), were available and 40,340 samples with the complete (or almost complete) mitogenome sequence (Table S2; Figure 1). This survey identified 110 mtDNAs that could be assigned unambiguously to haplogroup D4h based on mitogenome information as well as 112 mtDNAs likely belonging to D4h based on their HVS or genotyping data (Table S3), whose complete sequencing revealed 106 additional D4h mitogenomes (Figure S1). Furthermore, to reconstruct the evolutionary history of D4h, we also searched this haplogroup in 15,460 ancient samples compiled by indo-european.eu (https://indo-european.eu/ancient-dna/),30 thus covering virtually all global reported ancient mtDNA data, as well as additional 232 recently reported ancient mtDNA data from East Asia.31,32 This survey yielded 39 ancient D4h samples (30 with the entire mitogenome and nine with HVS data) (Figure 1; Tables S4 and S5), which reflected the rarity of Dh4 in ancient times. Therefore, we integrated these ancient and contemporary data of this rare haplogroup to fully investigate its origin and expansion history.
Figure 1. Geographic sources of mtDNA data employed in this study
Circles: populations surveyed for HVS variation are in light blue, while those surveyed for the variation of the entire mitogenome are in yellow. Only data from population surveys (99,722 samples from 1,135 populations) are shown. The remaining 1,597 mtDNAs are not shown on the map either because they were sporadic samples or because geographic information was lacking. For more details concerning the 101,319 samples, see Tables S1 and S2. Triangles: D4h samples, including published (hollow triangles) and newly sequenced samples (filled triangles). Ancient Asian samples harboring D4h mtDNAs were indicated by arrows, with the information shown on the right. The ancient samples from the Americas (see Table S4) are not shown.
To shed light on the origin of the NA founder D4h3a, we explored its ancestor D4h3. Our findings allowed an update of the D4h3 phylogeny and its branches (Figures 2A and S2). Specifically, to avoid any confusion, we kept the names of D4h3a and D4h3b and tentatively named their upstream nodes “pre-D4h3a” and “pre-D4h3b,” respectively. Different from the NA founder D4h3a, the other branches of D4h3 are mainly distributed in China. In detail, D4h3b1 (root type in Hebei Province in North China) is found in North and Central China, while D4h3b2 (root type in Hubei Province) is mainly distributed in Central China. Coincidentally, among the reported ancient mtDNA data from different locations in Eurasia, we found three ancient samples belonging to D4h3 dated as early as 14–15 kilo years ago (kya) in the Amur River Valley (located in northern North China).33 One of these mtDNAs, sample NE-5 (∼14 kya), derives from pre-D4h3a and is phylogenetically the closest (six mutations apart; Figure S2) to the NA founder D4h3a mitogenome. The remaining two, samples NE34 (∼14 kya) and NE-18 (∼7 kya), are both members of pre-D4h3b. Overall these findings indicate that the ancestral homeland of D4h3 is most likely Central and North China and that both branches of D4h3 were there during the Paleolithic period. These branches locate in Central/North China and reflect the closest Asian matrilineal link to D4h3a, one of the founder pan-American mtDNA haplogroups.25,26
Figure 2. Phylogeography of haplogroup D4h and its sub-lineages
(A) Phylogenetic tree of D4h, with branch lengths proportional to number of variants. Circles: mitogenomes from this study; diamonds: previously published mitogenomes; black outlines: present-day samples; red outlines: ancient samples. The different colors, consistent with those in (B), refer to the different geographic source regions.
(B) Geographic sources of D4h mitogenomes in (A). Numbers on the map refer to the codes of samples and correspond to those in Figure 2A and Table S3.
We then shifted our attention to haplogroup D4h, the most recent common ancestor of D4h3. Except for the NA D4h3a, the other D4h mtDNAs were predominantly found in China, mainly in North (48 out of 150 contemporary samples, discarding four with unknown geographic information) and Central China (44 out of 150) (Table S4; Figure S3). A relatively small number of D4h mtDNAs were also identified in Northwest China (n = 14), Southwest China (n = 16), South China (n = 5), Japan (n = 13), Southeast Asia (n = 7), and North Asia (n = 2) (Table S4; Figure S3). Interestingly, the majority of the ancient D4h samples were detected in the northern regions of China (Figure 1), supporting a similar D4h distribution in the past. Further phylogeographic analyses revealed that the ancient and current samples from the same geographic region tend to cluster together in the same sub-branch, e.g., D4h1a, D4h1c, D4h1d, and D4h3. Meanwhile, most sub-haplogroups of D4h are predominant in North/Central China (i.e., D4h1b, D4h1d, D4h1e, and pre-D4h3b) or showed connections between North/Central China and other regions, including western China (D4h1c and D4h4), Japan (D4h1a), North Asia and Japan (D4h2), and even the Americas (D4h3a) (Figures 2, 3A, and S4). Moreover, samples from South China, Southwest China, Northwest China, Southeast Asia, and North Asia were sporadically distributed across the whole D4h haplogroup and primarily located on the terminal branches (Figures 2A and S2), most likely as a result of gene flow. Finally, the peculiar distributions of certain lineages, for instance D4h1a in Japan and D4h1c in Southwest China (Figures 2A, 3A, and S2), likely indicate founder events.
Figure 3. Geographic distribution and schematic tree of haplogroup D4h
(A) Geographic distributions of different branches of D4h. Each circle represents one sample, with geographic origin of samples shown by different colors, consistent with those in Figure 2B. Contour maps display spatial frequency distributions of haplogroups (see Table S7). Circles without outlines represent datasets from phylogenetic rather than population studies and thus were excluded in calculations of spatial frequencies.
(B) Bayesian age estimates using complete mitogenomes. Sizes of triangles are proportional to sub-haplogroup sample sizes. Colors represent different geographic regions, consistent with Figure 2B. Ancient samples are indicated in red. Green and yellow diamonds show the divergences within the LGM and the last deglaciation, respectively.
(C) Extended Bayesian skyline plot (EBSP) of D4h, showing effective population size changes through time.
Given that some of the mitogenome data from literature are from phylogenetic rather than population studies, and given the relative scarcity of mitogenomes from Siberia, which will introduce bias to the phylogeographic analyses, we also collected and analyzed mtDNA HVS data from population studies (Table S1). Only few potential D4h samples were found in North Asian samples (n = 4,176) (for example, two belonging to D4h1d, which is defined by T16172C and C16174T, and one belonging to D4h1e, which is defined by C16174T and A16343G) (Figure S4), lending support to its rarity in North Asia. The median-joining network based on HVS data (Figure S4) revealed instead a much wider distribution range of D4h in Asia. Indeed, the majority of Asian D4h mtDNAs are observed in Central (58/228; 25.43%) and North (44/228; 21.05%) China, followed by Southwest China (35/228; 15.35%), Northwest China (15/228; 6.57%), Japan (29/228; 12.72%), Southeast Asia (11/228; 4.82%), South China (6/228; 2.63%), and North Asia (9/228; 3.94%). Moreover, the root types of the major branches, e.g., D4h1b, D4h1c, D4h1d, D4h1e, and D4h3b, are primarily found in Central and North China, while the terminal branches mainly contain samples from other regions, e.g., Southwest China, Northwest China, Southeast Asia, South Asia, and Central Asia. Finally, D4h1a and D4h2 are restricted to Japan and its surroundings, lending support to the founder events.
Taken together, these results indicate that the phylogenetic differentiation of D4h occurred somewhere in Central or North China, most likely in a region geographically close to the northern coast of China. In fact, among the North/Central China samples, more than half (64/92, 69.57%) were found in provinces along (Hebei, Liaoning, Tianjin, Shandong, Jiangsu, Shanghai, and Zhejiang) or near (Heilongjiang, Jilin, Beijing, Anhui, and Jiangxi) the northern coast of China (Table S4). Therefore, we propose that the northern coast of China might have played a critical role in the divergence and spread of D4h and its sub-haplogroups.
Two radiation events from northern coastal China contributed to NA and Japanese gene poolsCoalescent age estimations, updated by calibrated radiocarbon dates of ancient DNA samples using tip dating in BEAST (Tables 1 and S6), indicate that the radiations of D4h lineages (aged 32.39 kya, 95% highest probability density [HPD], 24.04–41.45 kya) occurred mainly within two time periods (Figure 3B). The first period fell within the Last Glacial Maximum (LGM; 26.5–19.0 kya),34 during which D4h3 (26.39 kya, 95% HPD, 20.19–33.21 kya), pre-D4h3a (22.29 kya, 95% HPD, 17.24–27.68 kya), pre-D4h3b (21.55 kya, 95% HPD, 16.18–27.94 kya), D4h1 (21.83 kya, 95% HPD, 15.56–29.08 kya), and D4h2 (20.05 kya, 95% HPD, 12.12–29.48 kya) (Tables 1 and S6) differentiated into separate sub-haplogroups (Figure 3B). Among these sub-haplogroups, D4h3a further dispersed and became one of the pan-American haplogroup of NAs (Figure 4A). This radiation echoes well with the divergence of basal American branches from ancient eastern Asians 23–20 kya,3 which was likely due to the LGM’s inhospitable climate in the northern regions of Asia.35 During the last deglaciation (19.0–11.5 kya), after the LGM, a second radiation of D4h occurred somewhere near the northern coast of China, as documented by D4h4 (18.11 kya, 95% HPD, 12.67–24.28 kya), D4h1c (16.17 kya, 95% HPD, 10.66–22.36 kya), D4h1a (15.59 kya, 95% HPD, 11.43–20.92 kya), D4h3b (13.22 kya, 95% HPD, 7.55–19.93 kya), D4h1c1 (12.77 kya, 95% HPD, 8.21–17.79 kya), and D4h1e (12.10, 95% HPD, 7.16–17.50 kya) (Figure 4B). Concordant with this phylogenetic radiation, a rapid increase in the effective population size of D4h ∼15 kya was observed in the extended Bayesian skyline plot (EBSP) (Figure 3C), probably due to the post-LGM climate improvement. These results uncover two waves of previously unknown population dispersals along the northern coast of China during the LGM and last deglaciation, which led to the origin and expansion of different D4h lineages (Figure 4). The regions around the Bohai, Huanghai, and East China Seas, which were still connected by land along the northern coast before the Holocene,36 probably allowed these expansions to occur.
Table 1. Coalescent ages of D4h and its sublineages
| Haplogroups/sub-haplogroups | Number of mitogenomesa | Age (mean [95% HPD]) (kya)b |
|---|---|---|
| D4h | 237 | 32.39 (24.04–41.45) |
| >D4h1 | 112 | 21.83 (15.56–29.08) |
| >>D4h1a | 13 | 15.59 (11.43–20.92) |
| >>>D4h1a1 | 12 | 12.24 (6.72–15.87) |
| >>>>D4h1a1a | 5 | 5.07 (1.83–8.56) |
| >>>>D4h1a1b | 7 | 5.66 (2.87–8.87) |
| >>D4h1b | 28 | 10.63 (6.26–15.53) |
| >>>D4h1b1 | 25 | 7.56 (4.41–11.06) |
| >>D4h1c | 40 | 16.17 (10.66–22.36) |
| >>>D4h1c1 | 35 | 12.77 (8.21–17.79) |
| >>>>D4h1c1a | 34 | 10.5 (7.01–14.61) |
| >>>D4h1c2 | 5 | 7.54 (3.43–12.46) |
| >>D4h1d | 18 | 10.26 (6.47–14.26) |
| >>D4h1e | 13 | 12.10 (7.16–17.50) |
| >D4h2 | 8 | 20.05 (12.12–29.48) |
| >>D4h2a | 7 | 10.78 (6.57–15.46) |
| >D4h3 | 96 | 26.39 (20.19–33.21) |
| >>Pre-D4h3a | 73 | 22.29 (17.24–27.68) |
| >>>D4h3a | 71 | 19.40 (15.11–24.05) |
| >>Pre-D4h3b | 24 | 21.55 (16.18–27.94) |
| >>>D4h3b | 22 | 13.22 (7.55–19.93) |
| >>>>D4h3b1 | 3 | 1.93 (0.29–4.05) |
| >>>>D4h3b2 | 19 | 6.18 (3.31–9.56) |
| >D4h4 | 21 | 18.11 (12.67–24.28) |
Ancient mitogenome data were included in coalescent age estimations. Incomplete sequences were excluded from age estimations (see Table S4 for details).
bThe mutation rate was recalibrated using the tip dating method. The best-fitting model was evaluated as previously described.37
Figure 4. Two subsequent population radiations in the northern coastal regions of China contributed to NA and Japanese matrilineal ancestry
(A) The first radiation occurred during the LGM and involved D4h3, pre-D4h3b, and pre-D4h3a (from which D4h3a, typical of NAs, was derived).
(B) A later population expansion in the same general geographic area occurred in the deglaciation period and involved D4h1a1 and D4h2, whose derivatives are found in modern Japanese and ancient Jomons.
Intriguingly, two haplogroups, D4h1a1 (12.24 kya, 95% HPD, 6.72–15.87 kya) and D4h2 (20.05 kya, 95% HPD, 12.12–29.48 kya), exhibited prevalent distributions in the Japanese Archipelago (Figures 2, 3A, and S4), suggesting that the expansions from the northern coast of China also exerted an influence in Japan. The discovery of D4h1a in ancient samples dated ∼11 kya from the Nenjiang River valley38 further supports its advent in regions close to Japan at least 11 kya. Similarly, D4h2 has been observed in ancient Jomons,39 who are considered the descendants of Paleolithic settlers in the Japanese Archipelago.40 The median-joining network (Table S5; Figure S4) showed that one branch of D4h2 (namely D4h2a) in China and Southeast Asia, while the other (D4h2b) is distributed in Siberians as well as the Ainu population (indigenous Japanese, 3 of 50 samples) and ancient Jomons. This further supports a genetic contribution possibly from China to different populations including Southeast Asians and ancient Japanese. Therefore, probably both D4h1a1 and D4h2 dispersed from China to Japan after the LGM, possibly via the land bridges that connected China and the Japanese Archipelago until 12 kya.41,42
Potential supports from Y chromosome dataThe origin of mtDNA D4h in northern coastal China of NAs echoes well also with the differentiation of Y chromosome haplogroup C2a-L1373 (ancestor to NA founder lineages C-MPB373 and C-P39) in low-latitude regions of northern Asia.43 To further evaluate the potential radiation center of C2a-L1373, we assessed the frequencies of C2a-L1373 and its sub-lineages in different provinces of China based on Y chromosome genotyping data from 23Mofang Biotechnology Co., Ltd (totally 458,805 individuals, each with 33,000 Y chromosome SNPs genotyped). We detected the root type (C2a-L1373∗) only in North China (including Beijing [0.020%], Tianjin [0.031%], Henan [0.004%], Heilongjiang [0.030%], Jilin [0.063%], Liaoning [0.071%], Shaanxi [0.035%]) and northwest China (Gansu [0.016%]; Table S8). It is worth underscoring that the highest C2a-L1373∗ frequencies were observed in Liaoning, Jilin, Heilongjiang, Tianjin, and Beijing (Table S8), which are all located close to northern coastal China. Moreover, the majority of other C2a-L1373 sub-lineages, including C-FGC28903, which is a sister branch of C-P39, harbor their highest frequencies in North China (Table S8). Moreover, samples belonging to C2a-L1373 in other places like South Asia, Central Asia, Europe, etc., were sporadically found or mainly occupied the terminal branches.43 This evidence strongly suggests that C2a-L1373 differentiated in northern China, especially in the regions near the coast, similarly to mtDNA D4h.
In addition, two ancient samples from Songnen Plain in northern China, dated ∼14,000 years ago, were found to belong to mtDNA D4h3 and Y chromosome C2a-L1373,33 thus revealing the coexistence of both maternal and paternal ancestor lineages of NAs in northern coastal China. Interestingly, C2-M217 (∼39.3 [34.7–44.5] kya)22 and D4h (∼32.39 [24.04–41.45] kya) had similar coalescent ages, and the divergence time of C2a-L1373 (about 21.6 [19.1–24.4] kya)22 is similar to the time of the first D4h radiation estimated in this study, making it likely that an ancestral population from this region contributed to both the maternal and paternal gene pools of NAs. In fact, besides lineages of mtDNA D4h and Y chromosome C2-M217, substantial maternal and paternal lineages have also been observed in this region, e.g., Y chromosome lineages C-F106744 and mtDNA haplogroups A5, D4a, D4b, D4e, N9a, etc.,29 most of which arose around the LGM.44,45 This lends support to the scenario that this region was a differentiation center in East Asia after the LGM, which probably facilitated the expansions of different lineages including mtDNA D4h3 and Y chromosome C2a-L1373. Meanwhile, Y chromosome haplogroup C2-M217 has also been observed at a higher frequency in the Ainu (15%) than in other Japanese (3%).46 Additionally, the coexistence of mtDNA D4h3 and Y chromosome C2 had also been reported in the same archaeological site in South America (∼8 kya).12 These observations collectively suggest that an ancestral population from northern China carrying mtDNA D4h and Y chromosome haplogroup C2 also spread into the Americas and the Japanese Archipelago.
DiscussionIn this study, by integrating ancient and contemporary mitogenomes of D4h from large-scale dataset covering virtually the whole of Eurasia, we traced the ancestry of one rare NA founder lineage (D4h3a) to a lower latitude region in northern coastal China around the Bohai and Huanghai Seas. This region is different from the geographical sources in Siberia hypothesized so far by the common maternal components, including mtDNA haplogroups A2, B2, C1, D4b1a2a1a, etc.7,17,19 Our study thus uncovered an additional ancestral source for the ancestors of NAs beyond Siberia from the matrilineal perspective. This ancestry, although only contributed to a small proportion of the mtDNA gene pool of NAs (D4h3a),25 would be important in complementing the whole picture of origination histories of early NAs.
Further support comes from the Y chromosome C2-M217, which harbors an age (∼40 kya) that is similar to the one of mtDNA D4h and also probably radiated in northern coastal China during the LGM (as indicated by C2a-L1373), when the first radiation of D4h occurred. Interestingly, these uniparental ancestries echo well with the ancient ancestry in eastern Asia (∼35 kya) that gave rise to East Asians, Siberians, and NAs at ∼26 kya.3 Meanwhile, it had also been inferred that about 40–23 kya, the ancestors of Jomons split from the ancient ancestry in eastern Asia.47 This evidence strongly supports the existence of an old ancestry source, arising between 40 and 23 kya, that contributed to populations including East Asians, Jomons, Eastern Siberians, and NAs (Figure S5). We propose that mtDNA D4h was one of the matrilineal lineages that witnessed these population splits and expansions. However, different from this East Asian ancestry contributing substantially to eastern Siberia,47 D4h has been rarely found in this area. One explanation would be the loss of D4h during the expansions by genetic drift or matrilineal replacement.48 More mtDNA data from Siberia will be of help to further assess this expansion process.
In addition, this genetic connection among China, the Americas, and Japan during the Pleistocene period parallels archaeological similarities, as early as Pleistocene period, among these regions. For instance, in the terminal Pleistocene period, Japanese microblades (18–17 kya), which exhibit similarities to those in Northeast Asia (including North China), display commonalities with contemporaneous stemmed points from incipient Jomon sites (∼15.5 kya).49 Importantly, stemmed points were well distributed around the Pacific rim from Japan to South America with close affinities with each other.50 Recent findings on stemmed projectile points in North America (Cooper’s Ferry site, ∼15–16 kya) show closer affinity to the nonfluted projectile points in Japan than to those in North Asia.51 We attribute this similarity in Paleolithic technology, as well as the phylogenetic relationships of D4h sub-lineages in China, the Americas, and Japan, to a probable Pleistocene connection among these regions (Figure 4B).
Our results also shed important light on the dispersal route of early NAs into the Americas. Given that mtDNA D4h radiated from northern coastal China, which is geographically close to Pacific coastal rim, we speculate that D4h would have documented LGM and post-LGM dispersals along the eastern Pacific coast. This echoes well with the dispersal D4h3a along the Pacific coastal path25 when the ice-free corridor was closed.11,52 Similarly, Y chromosome C-L1373, which probably radiated in parallel with mtDNA D4h, has also been reported in South Koreans (http://koreangenome.org/) and the Nivkh,53 thus lending support to a coastal population expansion scenario initiated from northern coastal China. This, together with the Paleolithic cultural affinities along the Pacific, e.g., stemmed points,51 and the palaeoecological feasibility of maritime dispersals (e.g., kelp highway hypothesis)54 lends further support to the coastal route hypothesis of early NAs.50,51,55
Limitations of the studyBy dissecting the origin of a rare NA founder lineage, our study revealed an ancestral root of both NAs and the Japanese in northern coastal China. However, some detailed expansions from this region into the Americas need to be further dissected. First, more data concerning mtDNA D4h from both ancient and contemporary samples are needed to elucidate the detailed expansion history of this lineage, especially from Siberia, where a relatively low number of mitogenomes have been assessed. Second, high-resolution Y chromosome data of C-L1373 from large-scale population dataset will help to verify this radiation from paternal perspective. Third, investigations integrating mitogenomes, the Y chromosome, and autosomal genomes are also essential to explore whether there are differences between maternal, paternal, and autosomal markers and thus complement the whole picture of origination history of NAs.
STAR★MethodsKey resources table| REAGENT or RESOURCE | SOURCE | IDENTIFIER |
|---|---|---|
| Deposited data | ||
| 106 whole mitochondrial genomes of D4h samples | This paper | https://bigd.big.ac.cn/gwh/; accession number: PRJCA006291 |
| Anzick-1 ancient mitochondrial genome | Rasmussen et al.56 | N/A |
| Shuká Káa ancient mitochondrial genome | Lindo et al.55 | N/A |
| Ancient 939 ancient mitochondrial genome | Cui et al.57 | GenBank:KC998701.1 |
| IPK13 ancient mitochondrial genome | de la Fuente et al.58 | N/A |
| I12364 ancient mitochondrial genome | Nakatsuka et al.59 | https://reichdata.hms.harvard.edu/pub/datasets/amh_repo/curated_releases/V52/V52.2/SHARE/public.dir/index_v52.2_MT.html |
| I1754 and I3443 ancient mitochondrial genomes | Posth et al.12 | https://reichdata.hms.harvard.edu/pub/datasets/amh_repo/curated_releases/V52/V52.2/SHARE/public.dir/index_v52.2_MT.html |
| I19950 ancient mitochondrial genome | Kennett et al.60 | https://reichdata.hms.harvard.edu/pub/datasets/amh_repo/curated_releases/V52/V52.2/SHARE/public.dir/index_v52.2_MT.html |
| I2263 ancient mitochondrial genome | Nakatsuka et al.4 | https://reichdata.hms.harvard.edu/pub/datasets/amh_repo/curated_releases/V52/V52.2/SHARE/public.dir/index_v52.2_MT.html |
| MHper11 ancient mitochondrial genome | Maár et al.61 | N/A |
| NE34,NE-5,NE36,NE-18 ancient mitochondrial genomes | Mao et al.33 | NGDC:PRJCA003699 https://bigd.big.ac.cn/gwh/ |
| BQ-M2-F and XZ-M149 ancient mitochondrial genomes | Liu et al.62 | NGDC:PRJCA002947 https://bigd.big.ac.cn/gwh/ |
| I7021 ancient mitochondrial genome | Wang et al.63 | https://reichdata.hms.harvard.edu/pub/datasets/amh_repo/curated_releases/V52/V52.2/SHARE/public.dir/index_v52.2_MT.html |
| HT-M45 ancient mitochondrial genome | Ning et al.38 | N/A |
| L3159 ancient mitochondrial genome | Ding et al.64 | NGDC:PRJCA002243 https://bigd.big.ac.cn/gwh/ |
| QT_T0601M64_2 ancient mitochondrial genome | Miao et al.32 | NGDC:PRJCA004284 https://bigd.big.ac.cn/gwh/ |
| Shimao_HJGD_M17 and ZS_M4O ancient mitochondrial genomes | Xue et al.31 | NGDC:PRJCA009290 https://bigd.big.ac.cn/gwh/ |
| Ancient Y-DNA and mtDNA | all-ancient-dna-2-07-7330 | indo-european.eu (https://indo-european.eu/ancient-dna/) |
| Software and algorithms | ||
| Cutadapt v1.16 | Martin65 | RRID:SCR_011841 |
| leeHom v1.2.16 | Renaud et al.66 | RRID:SCR_002710 |
| BWA v0.7.8 | Li and Durbin67 | RRID:SCR_010910 |
| Samtools v1.13 | Li et al.68 | RRID:SCR_002105 |
| schmutzi v1.5.6 | Renaud et al.69 | https://bioinf.eva.mpg.de/schmutzi/ |
| GATK v4.2.2 | McKenna et al.70 | RRID:SCR_001876 |
| BEAST 2.6.6 | Bouckaert et al.71 | RRID:SCR_010228 |
| Surfer v8.0 | N/A | https://www.goldensoftware.com/products/surfer |
| bmodeltest package | Bouckaert and Drummond72 | https://taming-the-beast.org/ |
| NS package | Russel et al.73 | https://taming-the-beast.org/ |
| Tracer v1.7.2 | Rambaut et al.74 | RRID:SCR_019121 |
| FigTree v1.4.4 | N/A | RRID:SCR_008515 |
| R v4.1.2 | R Core Team 2021 | https://www.R-project.org/ |
Further information and requests for resources and reagents should be directed to and will be fulfilled by the lead contact, Qing-Peng Kong (kongqp@mail.kiz.ac.cn).
Materials availabilityThis study did not generate new unique reagents.
Experimental model and subject detailsComplete mitogenomes of 106 samples belonging to D4h were sequenced in this study. The information of the subjects including the geographical origin, gender and age are shown in Table S3. The sample collection and experimental protocol were approved by the Ethics Committee at the Kunming Institute of Zoology, Chinese Academy of Sciences (Approval No. KIZRKX-2021-011), as well as by the Office of Human Genetic Resource Administration (OHGRA), The Ministry of Science and Technology (MOST), China (Approval No. 2022SLCJ0017). Informed consent was obtained from each individual before the study. For the genotyping data from 23 Mofang Inc., we only used Y chromosome data from customers who had signed the informed consents online to participate in this study and agree to share their genotyping information.
Method detailsScreening of D4h mitogenomes from datasetTo unravel the evolutionary history of this haplogroup and the expansion of its sublineage pre-D4h3a into the Americas, we performed a search of D4h mtDNAs in a large-scale dataset: 101,319 Eurasian individuals, including 60,979 for which only hypervariable segment (HVS) data (Table S1) were available, and 40,340 samples with whole mtDNA (sequencing and genotyping) (Table S2). For the HVS and genotyping data, the motif-search strategy75 was adopted to identify mtDNAs harboring diagnostic variants of D4h and its sublineages. This allowed the identification of 112 potential D4h mtDNAs (Table S3), which after complete mitogenome sequencing revealed 106 new Asian D4h mitogenomes (see below). These were added to 110 previously published D4h mitogenomes from contemporary populations and 30 D4h mitogenomes (Table S4) screened out from ancient samples for further phylogenetic analyses and coalescent age estimations.
DNA extraction, library construction, sequencing, and quality controlTotal genomic DNA was isolated by using the genomic DNA extraction kit (Axygen). DNA yield and purity were measured via UV spectroscopy. Libraries were prepared with a standard library kit (MyGenostics Inc., Beijing, China). Sequencing was carried out using an Illumina HiSeq X Ten platform at MyGenostics, with sequencing depths ranging from 3 823.63× to 15 727.02× (average of 7 359.76×; Figure S1). The Cutadapt software65 was used to trim adapters and to filter low quality sequences (including short reads, and reads with low mean quality score and many ambiguous (N) bases in fastq files. Reads were then aligned to the human reference genome version GRCH38 (which has the revised Cambridge Reference Sequence (rCRS)76 as mtDNA reference) by “bwa mem” (v0.7.10) (http://bio-bwa.sourceforge.net/). Duplications were detected and removed using the MarkDuplicates module of GenomeAnalysisTK (GATK) and the GATK HaplotypeCaller module was employed to generate the variant file (vcf) using standard parameters. The final variants of each sample relative to the revised rCRS were recorded (Table S3).
Ancient mtDNA acquisitionFasta files of ancient mtDNA sequences were downloaded from the literature or public database, with the exception of the mtDNA sequence of I4012,77 which was extracted from the whole genome sequencing data of that sample. In detail, we downloaded raw fastqof I4012 from ENA (European Nucleotide Archive) and then trimed adapters using leeHom v1.2.1666 and aligned to rCRS by using aln and samse commands of BWA v0.7.867 with parameters -n 0.01, -o 2, and -l 16500. Reads with mapping quality score (<30) were filtered by samtools v1.13.68 Finally, we obtained endogenous mtDNA fasta file and allocated it to haplogroup D4h1c according to the variants. However, due to the contamination rate of about 0.99 (calculated by schmutzi v1.5.6),69 we removed this sample in the subsequent analyses.
Quantification and statistical analysisHaplogroup affiliations and phylogenetic updates based on newly obtained and previously published dataHaplogroup affiliation of each sample was carried out according to mtDNA tree Build 17 (http://phylotree.org/).78 The phylogeny of D4h was reconstructed manually and checked using mtPhyl v5.003 (https://sites.google.com/site/mtphyl/). Many previously classified branches were confirmed, including D4h4, D4h1, D4h1a, and D4h1b, while others were updated, including D4h1c, D4h1c1, D4h1d, and pre-D4h3b. In addition, several novel branches were also defined, e.g., D4h3b1, D4h3b2, D4h1c2, and D4h1e (Figure S2).
Coalescent age estimationsModern and ancient sequences (Table S4) were aligned using MUSCLE v3.8.379 in MEGA6.80 Mutations including 309.1C(C), 315.1C(C), AC indels at 515–522, A16182C, A16183C, 16193.1C(C) and C16519T/T16519C were excluded in age estimations. bModelTest72 package implemented in BEAST 2.6.6 was used to select the most appropriate substitution model for our data. As a result, TN93 model (121,131) with gamma rate heterogeneity (G) and proportion of invariant sites (I) was supported through visualization output in Tracer v1.7.2. The Bayes Factor (logBF = 15) computed by BEAST NS package (32 particles) indicated the strict clock model is suitable for our data than the uncorrelated lognormal relaxed clock model. The midpoints of calibrated radiocarbon dates or archaeological periods of the ancient samples (Table S4) were used as the tip date.81 A date-randomization test82 using BEAST 2.6.6 showed the clockRate parameter from the original dataset of 95% HPD intervals (highest posterior distribution) did not overlap the date-randomized datasets, indicating there was sufficient tip date signal to calibrate the clock rate. The Chain Monte Carlo (MCMC) runs of 100,000,000 steps were performed with a sampling of parameters every 10,000 steps and the initial 10% steps were discarded as burn-in. Coalescent Constant Population was adopted as tree Prior.37 BEAUti within the package of BEAST was used to set the model and parameters. The convergences of MCMC were evaluated according to the effective sample size (ESS) by Tracer v1.7.2 (with ESS >200 as acceptable). As a result, whole mitogenomes without partitions into codon positions were adopted due to general higher ESS values (with only two ESS values between 100 and 200). The 95% HPD intervals of coalescent age estimates were recorded in FigTree v1.4.4.
In addition, Rho (ρ) statistics,83,84 which provides unbiased and overlapping estimates of coalescent ages,85 was also used to evaluate the coalescent ages of each clade in haplogroup D4h (Table S6).
Spatial geographic distributionGeographic locations of mtDNAs belonging to D4h and its sublineages were plotted using Surfer v8.0 (Golden Software Inc. Golden, Colorado, USA). Contour maps of spatial frequencies were constructed using the Kriging algorithm in Surfer v8.0. Samples non-deriving from population studies were excluded.
Extended Bayesian skyline plotsAn Extended Bayesian Skyline plot (EBSP)86 for effective population size (Nef) through time was reconstructed using BEAST v2.6.6,71 as described elsewhere.87,88 The midpoints of calibrated radiocarbon dates or archaeological periods of the ancient samples (Table S4) were used as tip dates,81 assuming 25 years for one generation. Each Markov Chain Monte Carlo (MCMC) simulation was run for 500,000,000 generations and sampled every 5,000 generations, with the first 50,000,000 generations discarded as burn-in. The EBSPs were reconstructed using EBSPAnalyser (10% buin-in) and visualized using an in-house R s**t.
Median-joining network reconstructionA dataset of D4h HVS sequences (n = 62), which encompasses 53 mtDNAs from contemporary populations and nine from ancient samples (Table S5), together with the corresponding HVS sequences extracted from the complete mitogenomes, was used to reconstruct a D4h median-joining network (Figure S4). The median-joining network was firstly constructed by Network 4.510 (http://www.fluxus-engineering.com/sharenet.htm) and then checked and reconstructed manually.89
We thank Dr. Qiaomei Fu for providing the ancient mtDNA sequencing data. This work was supported by the National Natural Science Foundation of China (31620103907, 81625013, 32170633, and 32150410355); the National Key R&D Program of China (2022YFC3302004); the Second Tibetan Plateau Scientific Expedition and Research (2019QZKK0607); the Strategic Priority Research Program (XDA20040102); Young Scientists in Basic Research (YSBR-076); the Key Research Program of Frontiers Science (QYZDB-SSW-SMC020); CAS “Light of West China” Program (Y.-C.L.) of the Chinese Academy of Sciences; the Digitalization, Development, and Application of Biotic Resource Program (202002AA100007); the Italian Ministry of Education, University and Research (MIUR) for Dipartimenti di Eccellenza Program (2018–2022) - Department of Biology and Biotechnology “L. Spallanzani,” University of Pavia (A.A., A.T., and O.S.) and Progetti PRIN2017 20174BTC4R (A.A.); the High-level Talent Promotion and Training Project of Kunming (Spring City Plan; 2020SCP001); Yunling Scholar of the Yunnan Province (Q.-P.K.); the Yunnan Ten Thousand Talents Plan Young & Elite Talents Project (Y.-C.L.); and Yunnan Fundamental Research Projects (202201AW070012).
Author contributionsQ.-P.K. conceived the study; Z.-L.G., Y.-C.L., and Q.-P.K. performed the analyses; Z.-L.G., B.-Y.Y., and L.-Q.Y. performed the mitogenome sequencing; Y.-C.L., Z.-L.G., K.-J.L., J.-Y.T., and Z.U.R. collected the data; Y.-C.L., Z.-L.G., K.-J.L., Q.-P.K., S.-H.Z., C.-T.L., A.A., O.S., and A.T. contributed to interpretation of results; Y.-C.L. and Q.-P.K. wrote the manus**t.
Declaration of interestsThe authors declare no competing interests. The authors from 23Mofang Biotechnology Co., Ltd, also declare no commercial or associative interests in connection with this work.
Inclusion and diversityWe support inclusive, diverse, and equitable conduct of research.
Supplemental informationDownload all supplementary files included with this articleWhat’s this?
Document S1. Figures S1–S5